If you missed the first diary you can view it here: http://www.dailykos.com/....
I'm lifting my "criticism ban" on my algorithm plan. However, my hope is to talk less about the flaws of such a plan and more about how the parties would do in the districts mentioned. Are there any districts the democrats could eventually gain by 2020 or ones that are a ticking time bomb for the democrats (meaning we'll eventually lose it.)? Another thing is names. I don't know who the Texas legislators are on a first name basis, especially since there are so many of them and because there was a lot of turnover in 2012. Maybe one of the posters who either lives in Texas and/or knows Texas politics better than I do can fill in the blanks.
Without further ado, here is districts 51-100 which include the eastern half of the metroplex, rural south Texas/central coast, and most of the San Antonio area.


HD 51

Racial Statistics: 48.3 Wh, 24.8 Hisp, 18.4 Bl, 6.4 Asn, 1.8 Oth, 0.4 Nat
PVI: R+9.5
Notes: This is I think Cindy Burkett’s district based in the blue collar suburb and politically marginal suburb of Mesquite and some of the more republican areas closer to Lake Hubbard. She has a reputation as a gadfly if I recall (voted for Paxton) but should be reasonably safe.
HD 52
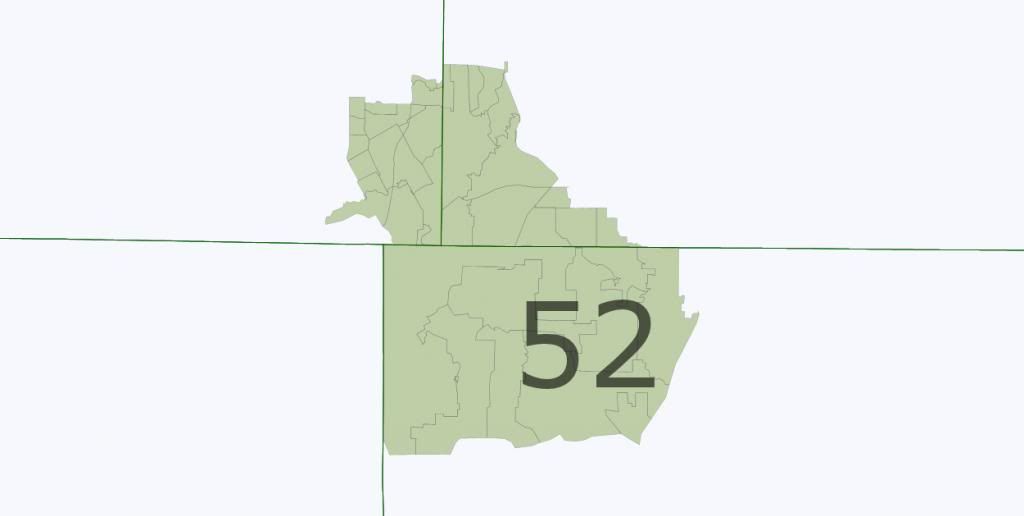
Racial Statistics: 47 Wh, 24.1 Bl, 19.4 Hisp, 7 Asn, 2.1 Oth, 0.4 Nat
PVI: R+6.7
Notes: This district takes in Ellis County, proceeds up HWY 287 to take in some of Arlington and also takes in the (relatively) whiter parts of South Dallas county. This I think is a new district without an incumbent. It should go to a republican.
HD 53

Racial Statistics: 49.7 Hisp, 30.1 Bl, 17 Wh, 2 Asn, 1 Oth, 0.3 Nat
PVI: D+15.1
Notes: This barely visible district is that of Roberto Alonzo’s. Should be safe for team D.
HD 54

Racial Statistics: 48.8 Bl, 42.1 Hisp, 7.7 Wh, 0.8 Oth, 0.4 Asn, 0.3 Nat
PVI: D+38.8
Notes: This is the most dem leaning district in the state and is either Yvonne Davis’ or Eric Johnson’s district. My guess is that Johnson runs in HD 56.
HD 55

Racial Statistics: 46.8 Hisp, 28.1 Wh, 22.2 Bl, 1.4 Asn, 1.2 Oth, 0.3 Nat
PVI: D+6.4
Notes: This is the East Side of Dallas and Balch Springs. I’d guess this is sort of a mixture between some blue collar/redneck whites, some recent Hispanic arrivals, and some blacks in the western part. Not sure whose district this is, but it is safe D.
HD 56

Racial Statistics: 49 Hisp, 27 Wh, 21.2 Bl, 1.4 Asn, 1.1 Oth, 0.3 Nat
PVI: D+9
Notes: This is Kenneth Sheets district but is made impossible for him to win. My guess is Eric Johnson would run against him here.
HD 57

Racial Statistics: 68.3 Bl, 17 Hisp, 12.5 Wh, 1.3 Oth, 0.6 Asn, 0.2 Nat
PVI: D+31.7
Notes: This is the only black majority district in Texas and takes in some southern suburbs of Dallas as well as the far southern edges of Dallas itself. This is Helen Giddings’ district.
HD 58

Racial Statistics: 52.6 Wh, 29.2 Hisp, 13.1 Bl, 3.4 Asn, 1.3 Oth, 0.3 Asn
PVI: D+2.1
Notes: This is essentially Dan Branch’s district shifted south and therefore made more dem leaning. My guess is that Rafael Anchia, considered to be one of the rising stars in the Texas House, would run against him. Lean/Likely d.
HD 59

Racial Statistics: 42.8 Wh, 27.8 Hisp, 18.7 Asn, 8.5 Bl, 2 Oth, 0.3 Nat
PVI: R+10.3
Notes: This was congressman Marchant’s district for eighteen years before being elected to the house. He was replaced by Jim Jackson, who was quite old and may have retired in 2012. Regardless, safe republican
HD 60

Racial Statistics: 47.4 Hisp, 23.2 Wh, 20.4 Bl, 7 Asn, 1.6 Oth, 0.3 Nat
PVI: D+6
Notes: This is basically the old HD 106. It was represented by Kirk England who was a republican that switched parties. He lost reelection in 2010 and the guy who unseated him might have lost in 2012 in turn. Not sure who beat him or if he’s still in office, but this should go to a democrat.
HD 61

Racial Statistics: 67.3 Hisp, 23.1 Wh, 5.3 Bl, 2.8 Asn, 1 Oth, 0.4 Nat
PVI: R+2.6
Notes: This is L.H. Brown’s district. She always seems to face tough reelection bids and this would continue with this district. Toss up.
HD 62

Racial Statistics: 58.5 Wh, 21 Hisp, 10.5 Bl, 7.7 Asn, 1.9 Oth, 0.4 Nat
PVI: R+15.5
Notes: This is based around DFW Airport and some of the suburbs in NE Tarrant County. It also contains Southlake which is very wealthy and has a high school that has one of the better football programs in the country. This was Vicky Truitt’s district for the past fourteen years who for some reason drew the ire of Empower Texans. She lost in the primary to Giovanni Capraglione who I think had tea party support. Not nearly as GOP as the old HD 98, its still a safe district.
HD 63

Racial Statistics: 43.6 Wh, 31.1 Hisp, 15.8 Bl, 7 Asn, 2.2 Oth, 0.4 Nat
PVI: R+5.2
Notes: This is another mid cities district based in Bedford, Euless and the northern part of Arlington. This was Kelly Hancock’s district who moved up to the state senate in 2012. The guy who won the seat was Jonathan Strickland, who I think is the youngest member of the state house. He should be ok, but could be toppled in a bad republican year.
HD 64

Racial Statistics: 60.4 Wh, 18.2 Hisp, 11 Asn, 7.9 Bl, 2.1 Oth, 0.4 Nat
PVI: R+16.6
Notes: This is based in southern Denton County which was the first part to experience suburban sprawl and still is. This was Burt Solomon’s district, but he decided to retire in 2012. Not sure who replaced him, but this is a safe GOP district.
HD 65

Racial Statistics: 42.5 Wh, 33.4 Hisp, 18 Bl, 4.2 Asn, 1.5 Oth, 0.3 Nat
PVI: R+2
Notes: This is Stefani Carter’s district. She is known for plagiarizing Obama in a speech to Dallas County republicans in 2010. Haven’t heard much else about her. Should be a tossup district.
HD 66

Racial Statistics: 48 Wh, 42.1 Hisp, 5.5 Bl, 3.1 Asn, 1.1 Oth, 0.2 Nat
PVI: R+11.7
Notes: This was Will Hartnett’s district who had been in the state house for 22 years. This district is even more republican than the old HD 114 and is also ancestrally GOP. I don’t know who replaced him, but this is a safe seat.
HD 67

Racial Statistics: 57 Wh, 15.9 Hisp, 12.8 Asn, 11.6 Bl, 2.4 Oth, 0.3 Nat
PVI: R+11.3
Notes: This was Jerry Madden’s district, who in Collin County circles was probably one of the “old-timers”. He retired in 2012 and his replacement was a guy by the name of Leach who was fairly young. It should be a safe republican district.
HD 68

Racial Statistics: 54.6 Wh, 18.4 Hisp, 13.7 Asn, 10.7 Bl, 2.2 Oth, 0.4 Nat
PVI: R+14.8
Notes: This is Jody Lautenberg’s district. Mostly McMansions and what have you. Safe R
HD 69

Racial Statistics: 61.5 Wh, 17.6 Hisp, 9.9 Asn, 8.3 Bl, 2.2 Oth, 0.4 Nat
PVI: R+15.4
Notes: I think this is Van Taylor’s district. He I think is a carpetbagger from Waco who ran against Chet Edwards and than ran here when the seat opened up. Regardless, Safe Republican.
HD 70

Racial Statistics: 42 Hisp, 29.5 Wh, 16.1 Bl, 10.6 Asn, 1.6 Oth, 0.3 Nat
PVI: R+2.2
Notes: This was republican Joe Driver’s district, who had been in office for nearly 20 years before being sent to the crowbar hotel for junket fraud. Not sure who replaced him but this should be a marginal district.
HD 71

Racial Statistics: 61 Wh, 19.3 Hisp, 9 Asn, 8.4 Bl, 2.1 Oth, 0.3 Nat
PVI: R+12
Notes: This is A.C. Button’s district. Should be safe republican
HD 72

Racial Statistics: 67.6 Wh, 14 Hisp, 8.8 Bl, 6.8 Asn, 2.3 Oth, 0.5 Nat
PVI: R+19.7
Notes: This was Ken Paxton’s district who was arguably the most RW member of the house before being elected to the senate. He was replaced by Scott Sanford. Safe R obviously.
HD 73

Racial Statistics: 62.3 Wh, 24.4 Hisp, 10.9 Bl, 1.3 Oth, 0.6 Asn, 0.5 Nat
PVI: R+20.7
Notes: This area from what I know is full of people who want to live close enough to Dallas for the amenities but still want to live sort of a rural lifestyle. This is Joe Pitts’ district and is safe republican
HD 74

Racial Statistics: 61.6 Wh, 16.4 Asn, 12.2 Hisp, 7 Bl, 2.5 Oth, 0.4 Nat
PVI: R+15.7
Notes: basically typical McMansions and big box stores on the Rayburn tollway. Don’t know if any incumbent lives here but its safe R.
HD 75

Racial Statistics: 68.6 Wh, 16.5 Hisp, 7.3 Bl, 4.8 Asn, 2.3 Oth, 0.5 Nat
PVI: R+19.4
Notes: This is a collection of some wealthy areas along Lake Lewisville. This is Myra Crownover’s district.
HD 76

Racial Statistics: 88.9 Hisp, 9.8 Wh, 0.7 Asn, 0.3 Bl, 0.2 Oth, 0.1 Nat
PVI: D+10.7
Notes: Based in some rural and exurban areas between Harlingen and Brownsville. This district is either Lucio’s or Oliveira’s (who’s one of the old-timers in the house). Safe D.
HD 77

Racial Statistics: 91.3 Hisp, 7.6 Wh, 0.6 Asn, 0.2 Bl, 0.2 Oth, 0.1 Nat
PVI: D+18.1
Notes: most of Brownsville and some areas along the coast. Safe D.
HD 78

Racial Statistics: 93 Hisp, 6.4 Wh, 0.4 Asn, 0.1 Bl, 0.1 Nat, 0.1 Oth
PVI: D+21.7
Notes: A lot of rural areas in Hidalgo County with Weslaco being the largest city. Probably very poor and is overwhelmingly democratic.
HD 79

Racial Statistics: 72.5 Hisp, 24.1 Wh, 1.4 Bl, 1.3 Asn, 0.6 Oth, 0.2 Nat
PVI: R+2.5
Notes: Basically the coastal areas between Corpus Christi and Brownsville/Harlingen. The resort areas around South Padre seem to be republican. Not sure whose district this is, but it could go to a moderate R.
HD 80

Racial Statistics: 55.7 Hisp, 36.5 Wh, 3.7 Bl, 2.6 Asn, 1.1 Oth, 0.3 Nat
PVI: R+8.3
Notes: Essentially the wealthier areas along the south bay of Corpus Christi. This is Todd Hunter’s district. Hunter ran unopposed in 2012 and should be safe until proven otherwise.
HD 81

Racial Statistics: 92.5 Hisp, 6.5 Wh, 0.5 Asn, 0.2 Oth, 0.2 Bl, 0.1 Nat
PVI: D+20.2
Notes: Pharr, San Juan, Alamo and parts of McAllen. Heavily Hispanic and safely dem.
HD 82

Racial Statistics: 86.4 Hisp, 10.8 Wh, 2 Asn, 0.5 Bl, 0.3 Oth, 0.1 Nat
PVI: D+9.3
Notes: My guess is that this is the wealthier part of Hidalgo County – old time landowners and fruit growers. Not nearly as dem leaning as the surrounding districts but should be safe for a democrat
HD 83

Racial Statistics: 89.1 Hisp, 9.3 Wh, 1 Asn, 0.3 Bl, 0.2 Oth, 0.1 Nat
PVI: D+10.7
Notes: Some more rural and exurban areas in western Hidalgo county. Don’t know sure whose district this is but is safely democratic.
HD 84

Racial Statistics: 94 Hisp, 4.8 Wh, 0.6 Bl, 0.5 Asn, 0.1 Nat, 0.1 Oth
PVI: D+23.9
Notes: I think this is the old HD 40 which was Aaron Pena’s. He was a democrat that for some reason switched to the republicans. With no chance at reelection he decided to retire. This is Terry Canales district and is obviously safe.
HD 85

Racial Statistics: 94 Hisp, 5.2 Wh, 0.3 Bl, 0.3 Asn, 0.2 Oth, 0.1 Nat
PVI: D+19.7
Notes: Another mostly rural, heavily Hispanic and heavily democratic district. It does take in the southern part of Laredo though.
HD 86

Racial Statistics: 71.8 Hisp, 23.8 Wh, 3.2 Bl, 0.6 Oth, 0.3 Asn, 0.2 Nat
PVI: D+1.5
Notes: Takes in the most dem parts of Corpus Christi and some rural areas to the east. I think Solomon Ortiz’ son represents this district and he should be safe.
HD 87

Racial Statistics: 92.6 Hisp, 5.5 Wh, 0.9 Asn, 0.5 Bl, 0.3 Nat, 0.2 Oth
PVI: D+15.1
Notes: Although it looks like a rural district, most of the population is in Laredo. This was Henry Cuellar’s old district and is obviously safe D.
HD 88

Racial Statistics: 70 Hisp, 27.6 Wh, 1.1 Bl, 0.6 Oth, 0.4 Asn, 0.2 Nat
PVI: R+3.9
Notes: I call this the I-37 district. A lot of very flat rural area between SA and CC. Large Hispanic population but there is a large enough white population that votes maybe 80-20 GOP to cancel it out (and a lot of the Hispanics are undocumenteds). Probably a tossup district.
HD 89

Racial Statistics: 76.1 Hisp, 21.9 Wh, 0.9 Bl, 0.4 Asn, 0.4 Oth, 0.2 Nat
PVI: D+0.6
Notes: Some rural areas between Metro SA and the border. Should be won by a blue dog Hispanic democrat (think of someone like Cuellar).
HD 90

Racial Statistics: 58.5 Wh, 34.4 Hisp, 3 Bl, 2.1 Asn, 1.6 Oth, 0.4 Nat
PVI: R+22.5
Notes: Some rural and ancestrally republican areas to the northwest and some suburban/exurban areas of Bexar County. This is Harvey Hilderbrand’s district. Hilderbrand has been in office since the Clements era and is chairman of the Ways and Means committee. Safe R.
HD 91

Racial Statistics: 48.4 Wh, 44.3 Hisp, 5.1 Bl, 1 Oth, 0.9 Asn, 0.3 Nat
PVI: R+16.9
Notes: I’m not sure whether the 91st or 92nd is Geanie Morrison’s district. Both are very rural central coast districts that is sort of a transition toward rural east and central Texas and Hispanic south Texas. But since whites outvote Hispanics, this is a safe republican district.
HD 92

Racial Statistics: 53.7 Wh, 36.9 Hisp, 6.9 Bl, 1.5 Asn, 0.9 Oth, 0.2 Nat
PVI: R+23.1
Notes: See HD 91 only whiter and more republican
HD 93

Racial Statistics: 49.3 Wh, 35.1 Hisp, 12 Bl, 2.1 Asn, 1.2 Oth, 0.3 Nat
PVI: R+18.5
Notes: This is essentially a transition between the Houston exurbs and the central coast. This is Bill Zerwas’ district. Though a conservative, he has supported expanding Medicaid to Texas. Safe R Regardless.
HD 94

Racial Statistics: 48 Wh, 35.9 Hisp, 10.5 Bl, 2.8 Asn, 2.5 Oth, 0.3 Nat
PVI: R+11.7
Notes: This is basically some newer suburban areas NE of San Antonio along I-35. Should be safe republican.
HD 95

Racial Statistics: 54 Wh, 40.8 Hispanic, 3.2 Bl, 1 Oth, 0.6 Asn, 0.3 Nat
PVI: R+17
Notes: Basically a rural district east of San Antonio with some exurban turf in Guadalupe and Hays County. Safe R.
HD 96

Racial Statistics: 55.5 Hisp, 32.3 Wh, 6.7 Bl, 3.2 Asn, 2.1 Oth, 0.2 Nat
PVI: R+1.4
Notes: A fairly marginal district just outside the 410 beltway and the home of SeaWorld SA. This might be Joe Farias’ district.
HD 97

Racial Statistics: 78.9 Hisp, 13.3 Wh, 5.2 Bl, 1.3 Asn, 1.1 Oth, 0.2 Nat
PVI: D+11.5
Notes: This is the outer edge of inner city San Antonio and takes in some inner ring suburbs. Don’t know whose district this is, but should be safe D.
HD 98

Racial Statistics: 86.3 Hisp, 10 Wh, 2.4 Bl, 0.6 Oth, 0.5 Asn, 0.2 Nat
PVI: D+19.4
Notes: A poor, heavily Hispanic and democratic SA district. Don’t know the incumbent. Next.
HD 99

Racial Statistics: 75.3 Hisp, 13.7 Wh, 9.4 Bl, 0.8 Oth, 0.6 Asn, 0.2 Nat
PVI: D+20.8
Notes: This is the part of San Antonio where a lot of the cultural attractions are like the Riverwalk with a myriad of Mexican restaurants, the Alamo and the Alamo dome. This was Joaquin Castro’s old district. Don’t know who replaced him, but any dem with a pulse will win.
HD 100

Racial Statistics: 51.4 Hisp, 22.7 Wh, 21.8 Bl, 2 Asn, 1.8 Oth, 0.3 Nat
PVI: D+8.7
Notes: On paper, this should be no different than the 96th district being a suburban and marginal seat. The white percentage is lower but the district has the only sizable black population in San Antonio who not only vote 90+ percent for democrats but also turn out higher than Hispanics, making this a safe district. I think R.M. Jones represents this district.
