I was very grateful for all the attention I got for my last diary on Clinton's areas of strength and weakness relative to Dukakis in 1992 and 1996. Still, despite all the work I put into that diary, there were some things I didn't really understand about 1992 and its relation to 1996, and some other things I hadn't looked into yet. I still think I got the basic idea right, but hopefully this diary can correct some of my fuzziness and omissions. I also have a national CD map for 1992 courtesy of U.S. Elections Atlas user Fuzzybigfoot.
We're often told that Perot took evenly from Clinton and Bush in 1992. As we'll see, there's good reason to think that's largely true.
But there's also good reason to think that varied significantly by region, with Perot probably taking more from Bush in the South, more from Clinton in the farmland/Midwest, and about evenly everywhere else. Does that change my story? Not really--Clinton still improved the most in urban and suburban areas. Let's find out more.
Introduction:
My last diary mostly compared 1988 to 1996, and my thesis was that Bill Clinton's strength, relative to previous Democratic nominee Mike Dukakis, was mostly in urban and suburban areas, not in rural or Southern areas. My method was pretty simple--I just looked at the change in Democratic raw vote share by Congressional district.
As I said above, I was happy for all the attention my last diary got, but I didn't really have a handle on 1992, when Ross Perot's third party vote share was much larger overall.
I should have tried regression analysis right from the start. After a number of useful conversations with twohundertseventy, I eventually decided I had to look regionally.
I tried different regressions in different regions, but I eventually got a nice result by breaking Perot's vote share up into different variables and attempting a national equation. (It's a bit different if you look region by region, but then you can't really tell a national story.)
I omitted Arkansas and Tennessee from the spreadsheet altogether, and used my trusty Wessa.
The rounded version of the equation I got is:
Clinton = 7.44 + 0.99*Dukakis -0.22*PerotFarm + 0.13*PerotSouth + 0.04*PerotElse.
"Clinton" and "Dukakis" are two-party vote shares.
"PerotFarm" gives Perot's vote share in Minnesota, Wisconsin, Iowa, North Dakota, South Dakota, Kansas, and Nebraska, and it's 0 elsewhere.
"PerotSouth" gives Perot's vote share in Virginia, North Carolina, South Carolina, Florida, Georgia, Mississippi, Alabama, and Lousiana, and it's 0 elsewhere.
"PerotElse" is Perot's vote share everywhere else, but it's 0 in the above two regions.
The r-squared on this equation is 0.94. PerotFarm is undeniably significant, PerotSouth is highly significant, and PerotElse is weakly significant if at all. Either way, the coefficient of PerotElse is quite small.
(Another caveat: I think there's a randomized element to the algorithm, so I get slightly different equations from one time to another, which in turn slightly changes what the map would be. For example, one version may have made OH-06 and/or OH-18 light blue, but I'm not sure.)
You could tweak the regions endlessly (I think I got a very, very, very slightly worse fit by taking Minnesota out of "farm", for example, which also reduced the significance of the non-farm Perot variables, and limiting the regression to the farmland actually gave Perot a large positive coefficient for some reason--perhaps because it could just scale Clinton back altogether) but this equation has a pretty good fit, and I think it also makes intuitive sense.
What's the intuition?
-Clinton had, on average, a relatively uniform improvement over Dukakis. The regression equation is very close to "Clinton = Dukakis+Constant".
-On average, Perot had little effect, except in the farmland and in the South.
-In the farmland, Perot took more from Clinton, or more likely, he took the voters Dukakis atypically over-performed with.
-In the South, Perot took more from Bush, or more likely, the South simply had fewer "Perot Democrats" than elsewhere.
A regression analysis isn't a proof, of course, but that's the story this equation suggests, and I think it's a plausible one.
Assuming this is a decent model, the next question is:
Where did Clinton do well or do poorly relative to that model?
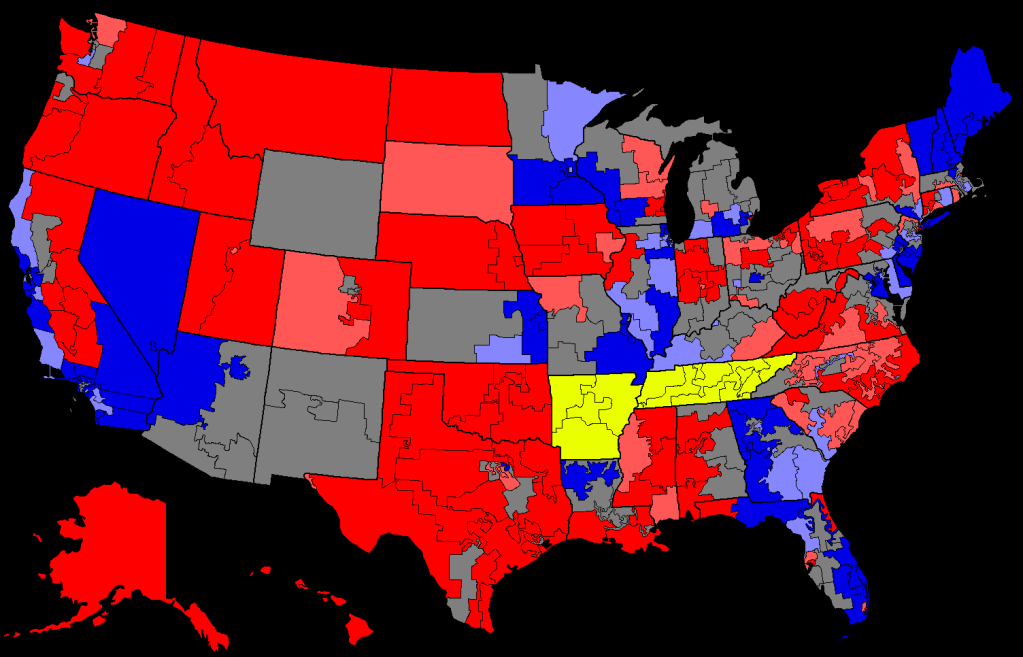
Using a national template of 1992 Congressional Districts courtesy of U.S. Elections Atlas Forum contributor Fuzzybigfoot, I put together a map.
Red districts had Clinton perform two points or more worse than the equation. Pink districts had him under-perform by between one and two points. Light blue districts had him over-perform by between one and two points, and dark blue districts had him over-perform by at least two points. Arkansas and Tennessee are yellow to emphasize how they weren't included in the equation (my dude's idea).
(NYC proper/Northern NJ is a bit of a mess, since it's a couple of pixels per district--probably best to ignore it. Miami, Chicago, and Dallas are a bit messy too, but I think they're right. Meanwhile, the template didn't quite match OurCampaigns for the MN districts, but it's only a matter of boundaries between dark blue districts. )
Here's the map:
Some thoughts:
1. Clinton's supposed strength in the South and Appalachia is not particularly apparent from this map, is it?. There's a lot of red throughout.
The best-case scenario for that hypothesis is that Clinton, himself, was responsible for the apparent lack of "Perot Democrats" in the South--that he held on to the voters that Perot took from him elsewhere. However, I think the South is simply not very friendly to third-party candidates, and in any event there's a certain continuity with PA, OH, and WV--which aren't in my "South" region.
2. Even if something's going on with Perot, I think it'd be a bit strange to try to jigger things to make Clinton's performance in Appalachia and the South the main point.
The biggest story, as far as Clinton's over-performance goes, is very likely in urban areas and especially in the Southwest.
Clinton's three largest over-performances were in CA-24 (Malibu), CA-25 (outer L.A. County) and CA-49 (San Diego). In fact, 7 of Clinton's 10 best districts were in Southern California or Nevada (NV-01, specifically). The other three were PA-03 (Northeast Philadelphia), FL-23 (Alcee Hasting's district in the Miami area), and NH-02.
3. The 101 dark blue districts mostly form a few contiguous clusters. The largest is Los Angeles/Nevada/Phoenix, and that cluster, along with the Philadelphia, Bay Area, Chicagoland, Georgia/North Florida, Miami/South Florida, Minnesota/Western Wisconsin, Northern New England, Long Island/outer NYC NYC, and D.C. suburbs/Baltimore clusters have 86 of Clinton's best districts. A couple of these areas are themselves connected by light blue districts.
4. As far as stereotypical rural/"bubba" areas go, according to this equation, Clinton did best not in Appalachia itself, but rather around certain parts of the Mississippi river (north of Mississippi itself). Compare the light blue KY-01 in western Kentucky to the light red KY-05 in eastern Kentucky, for example.
Since both Clinton and Gore's home states were from around here, they might have had a sort of "home region effect multiplier".
5. The Tampa/Orlando corridor, Colorado, and North Carolina weren't really emerging as Democratic strongholds yet. In my last diary, it seemed like Tampa/Orlando had emerged by 1996, but I'm not sure if that holds from a regression perspective.
6. Even though things are broken up, it's possible that some of the blue or red regions still represent Perot's performance being differently distributed in different areas. For example, the blue districts in Kansas and Minnesota might have had Perot take more evenly from Clinton and Bush than he did elsewhere in farmland.
Similarly, the Central Valley might have had Perot take more from Clinton than he did elsewhere in California--a sort of "mini farmland" region. On the other hand, that could simply be about Dukakis' strong rural performance, and it might have shown up even if Perot hadn't run.
Conclusion:
I'm very curious to see what happens between 2008 and 2012.
Polls and pundits (at least as filtered through DKE) give the vague impression that Romney will over-perform in certain kinds of well-educated suburbs, but will under-perform in Ohio. After all, he's a jackass C.E.O. who wanted Detroit to go bankrupt and so on and so on.
Maybe so--but I really don't know how much the candidate's personality and biography matters with this stuff.
I looked at an article (this one) after the 1996 elections where strategists on both sides thought that Clinton's base shifted between 1992 and 1996--that in the former election, he had more of the "Reagan Democrat" base, and in the latter election, he shifted more towards suburbia.
By the way--I think this story is somewhat more consistent with my story than you might think.
Other articles gave me the sense that the "Reagan Democrats" were often in urban and suburban areas, and that these specific areas were not yet unified behind the Democratic party as they often are now.
But anyway--maybe Dem strength shifted into urban and suburban areas from 1988 to 1992 because of Perot and Dukakis' rural strength.
Then maybe it happened again from 1992 to 1996 because of Clinton's policies.
And then maybe it happened again from 1996 to 2000 because people wanted to have a beer with George W. Bush and Al Gore was stiff.
And then maybe it happened again from 2000 to 2004 because of gay marriage and 9/11 and John Kerry wind-surfing.
And then maybe it happened again from 2004 to 2008 because Barack Obama is a black Ivy League type who thinks people cling to guns and religion and who was running against a "scots-Irish war hero" and his Mama Grizzly running mate.
But maybe these were general and long-term trends based on history, demographics, and the kinds of policies that don't change much from candidate to candidate. Doesn't mean they'll go on forever, though.
(A fun possibility is that Clinton's "profile" really did determine where he over-performed in 1992--but it was the Rhodes Scholar/Yale Law part of his "profile", not the accent.)
Appendix: My Stupidest Mistake.
In my last diary, I made much of the relationship between Clinton's change from Dukakis and Bush's change from 1988 to 1992 or 1996.
What I didn't realize is how this is simply a matter of arithmetic!
You see, in my spreadsheet, I take Perot to be the "Other" in 1992 and 1996, so:
Clinton+Bush92+Perot=100.
But, of course, in 1988:
Dukakis+Bush88=100.
So:
Dukakis+Bush88=Clinton+Bush92+Perot.
or:
(Clinton-Dukakis)+(Bush92-Bush88)+Perot=0.
In other words, the messy relationship between the Democratic and Republican changes in 1992 was entirely a result of Perot's performance varying in
size a fair amount.
It didn't necessarily mean that his performance varied in composition.
But I think this diary provides some evidence that it did, at least sometimes.
As always, looking forward to any thoughts or reactions.
Wessa, P. (2012), Free Statistics Software, Office for Research Development and Education,
version 1.1.23-r7, URL http://www.wessa.net/
Information on the districts came from OurCampaigns, with the district-by-district results courtesy of David Nir.
8:55 AM PT: It's also possible that the splitting of Perot into regional variables is a "hook" to reflect Clinton's relative improvement in the South and/or his relative drop in the farmland. Still, Perot had a positive coefficient even when I limited it to the South, and Perot also did somewhat worse there than he did nationally.
