Dems control both houses and the governor’s office in Arkansas, yet they managed to draw a congressional map in which all four districts favor the GOP. This exercise is to test whether the Dems could have gotten a better map by passing no bill at all, and instead letting a court handle it.
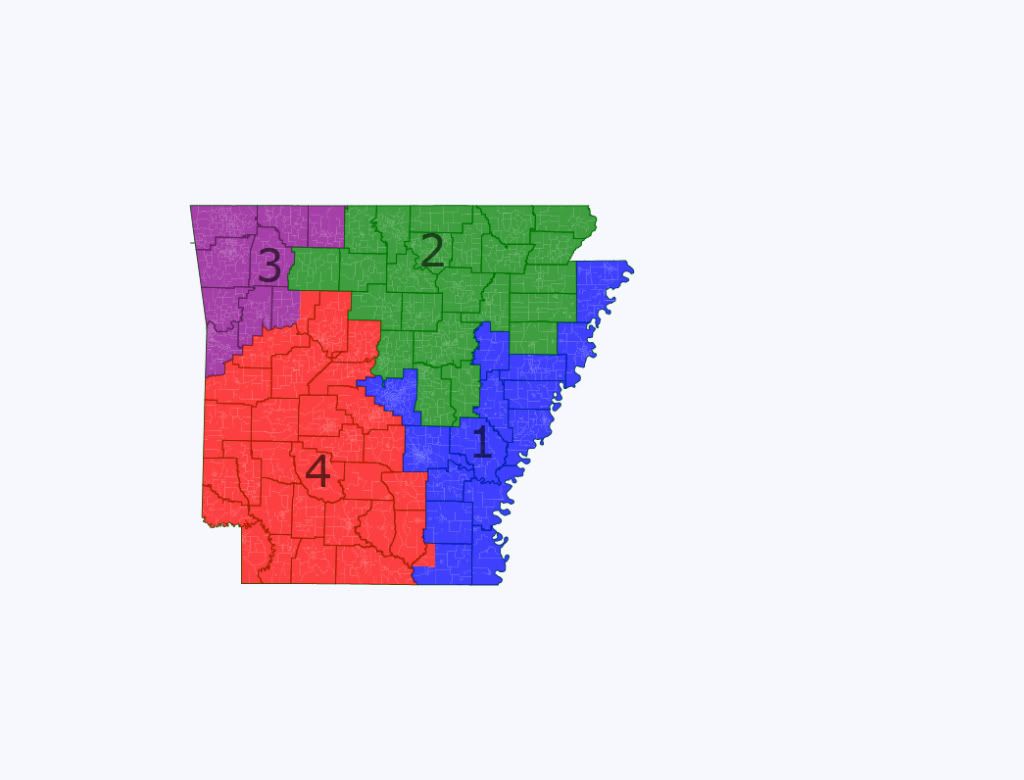
The map:

The districts, with PVI based on 2008:
AR1: This has most of the eastern part of the state outside the greater Little Rock area. It is largely rural, with Jonesboro and Pine Bluff as the two semi-urban areas. Pine Bluff and most of the areas along the Mississippi are heavily black and thus Dem-friendly, while the rest of the district is very white and very red. Overall the adult population is 27% black and the district is about R+8. Dems could compete there with the right candidate.
AR2: Little Rock and its exurbs, plus White county further up I-30. Little Rock is blue, but the rest of the district is really red even for Arkansas. Overall this district is 20% black and about R+9, not much more red than AR1 as its white population is more urban and slightly less conservative. It’s comparable to the district they actually drew and as in AR1 the right Dem might be able to contest it.
AR3: This corresponds to the Ozark plateau, with most of the population in the Fayetteville-Bentonville area in the northwest corner. I could have put most of the rural areas between Jonesboro and Fayetteville into AR1 and Fort Smith into AR3, but this would have forced AR4 to stretch from the southwest corner to the northeast corner which I think would be less plausible than this map. Anyway, this AR3 is just 1% black and R+18.
AR4: The I-40 corridor from Fort Smith most of the way to Little Rock, and Bill Clinton’s old stomping grounds in the state’s southwest quadrant. 9% black, but at R+20 it’s even more red than the lily-white AR3. Explanation: Fayetteville is in AR3, and like most southern towns with big state universities it serves as a containment area for moderate and liberal whites.
So this map has two districts that Dems may be able to win without getting a perfect storm. The actual map they drew has one, with AR2 at around R+9. The actual AR1 is R+13 and AR4 R+15. These might not be 100% out of reach as all of Arkansas outside the Ozarks is ancestrally Dem and recently open to voting for Dems even at the House level, but certainly much harder to win than the hypothetical AR1. Forget AR3, as any plausible version of it would probably be among the last 50 districts held by the GOP even in the event that they were nearly wiped out at the national level.
Conclusion: A court would likely have drawn two semi-competitive and two safe red districts. Dems actually drew one semi-competitive district, two that heavily favor the GOP, and one safe red. I suspect that the odds of an Arkansas Dem winning an R+8 are more than twice the odds of winning an R+13 to R+15, and as such they probably would have had more success over the decade with a court-drawn map than with the dummymander they actually drew.
What should the Dems have done? Maybe draw a district in which they would actually be favored, by attaching Little Rock and Pine Bluff to the Mississippi river counties. In this map, AR1 is 37% black and about D+2 without splitting any counties more than necessary to achieve population balance.