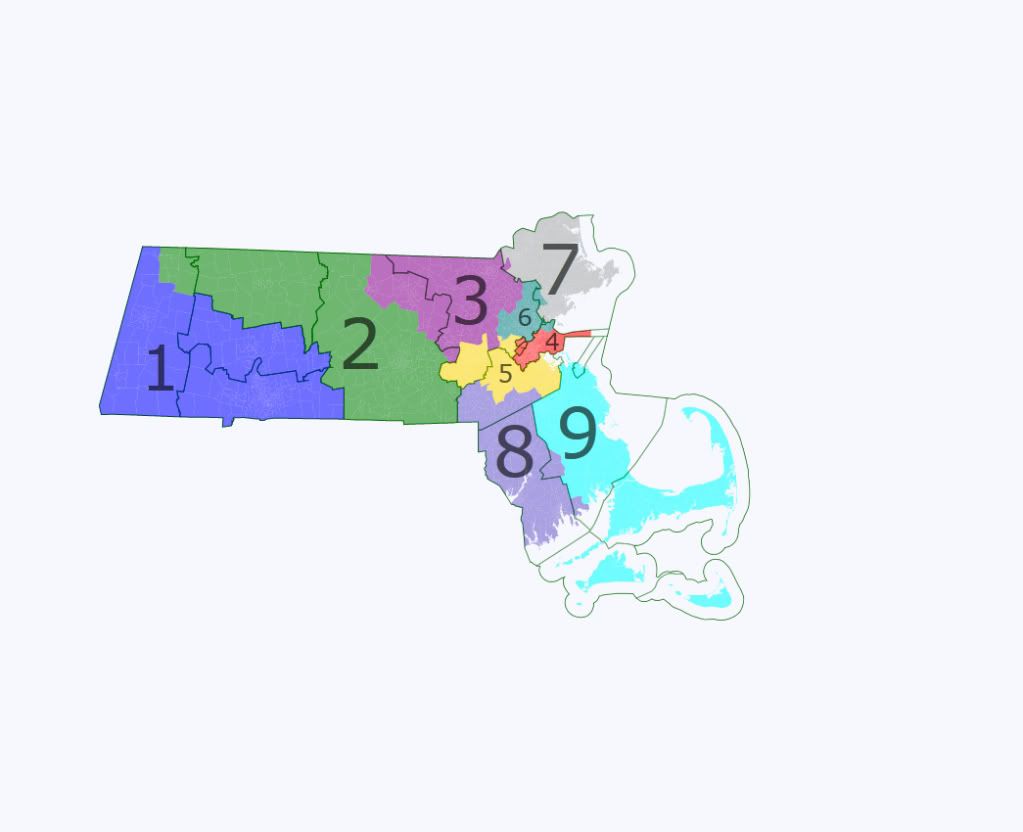
The court did not draw Massachusetts' new map, as Democrats have total control. This map is intended as a neutral “baseline” to measure how much of an edge the Democrats got from their eventual map. I tried to keep cities, counties, and metro areas together where possible. Apart from 1 and 2 in the west and 9 in the southeast, I picked the district numbers to provide the best color contrast. The map lists D/R “averages” for the district but these appear to be based mainly on Martha Coakley's virtuoso performance in the 2010 special election because 5 of the 9 districts are shown as having a sizable GOP edge and one of the others is about 50-50. PVIs are based on the 2008 presidential election.
State map: (the offscreen stuff is all in MA9)
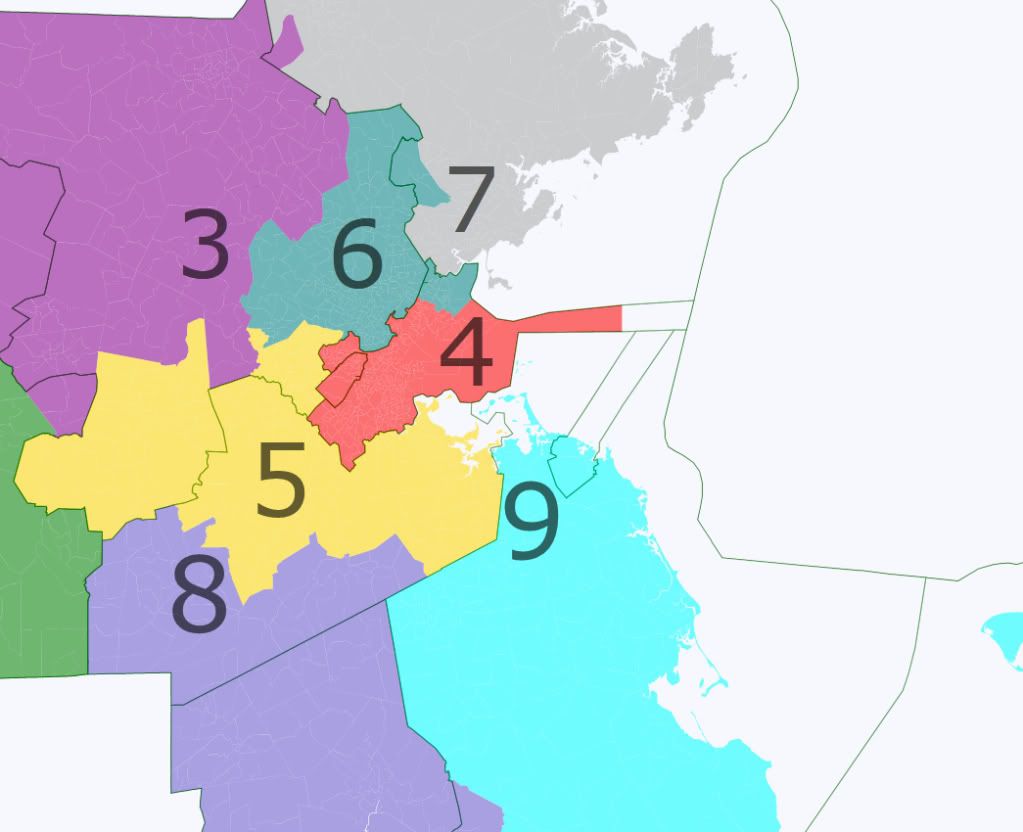
Boston closeup:
MA1: Springfield-based district including Hampshire county just north of it and most of Berkshire county at the far west end of the state. D+14.1, 56.9 D average. Safe D.
MA2: Worcester-based district that had to pick up rural Franklin county and the northeast corner of Berkshire because they wouldn't fit anywhere else. D+5.9, 46.0 D average. Very likely D.
MA3: Mostly the west end of Middlesex county, but with much of the northeastern fringe of Worcester county. D+4.4, 43.9 D average. Likely D.
MA4: Boston, Brookline, Winthrop, and almost all of Chelsea. D+26.1, 71.8 D average. Safe D.
MA5: Southern Boston burbs plus Newton, Watertown, and the Framingham area further west. D+9.9, 51.0 D average. Safe D.
MA6: northern Boston burbs. D+15.5, 59.1 D average. Safe D.
MA7: Essex county, less Lynnfield and a small piece of Andover. D+7.1, 45.7 D average. Very likely D.
MA8: Bristol county plus southern Norfolk and a small piece of Plymouth. D+6.5, 45.5 D average. Very likely D.
MA9: Plymouth county less Lakeville and Mattapoisett, plus the cape, the islands, and Cohasset which for some bizarre reason declined to follow its neighbors Hull and Hingham into Plymouth county in 1803. D+2.3, 42.7 D average. Lean D.
Only a few towns ended up being split:
Gardner has 1 precinct in MA2, the other 10 in MA3.
Wayland has 1 precinct in MA3, the other 3 in MA5.
Andover has 1 precinct in MA3, the other 8 in MA7.
Waltham has 2 precincts in MA5, the other 16 in MA6.
Millis has 1 precinct in MA5, the other 2 in MA8.
Chelsea has 1 precinct in MA6, the other 15 in MA4.
The GOP would be able to compete in MA9 in most years, MA3 in some years, and MA2, 7, and 8 in red wave years. On average, I think they would win maybe 1 of the 9 districts. Thoughts?
