This map improves several of the Democratic districts: the 3rd, 11th, 12th, and 13th. In addition, it screws Republican Rep. Aaron Schock, and gives a GOP vote sink to quasi-moderate Tim Johnson. The reason for this is that Johnson is actually running in the 13th, a Dem-leaning district, which he has a shot at winning. This ensures that the 13th elects a Democrat, while a semi-moderate Republican takes up a GOP vote sink. He's not quite Walter B. Jones, but it's still nice to have a moderate taking up a conservative area. In addition, Schock may make a decent statewide candidate in the future, so this would eliminate him from Congress. He would be put in a primary with Adam Kinzinger and Donald Manzullo. If Kinzinger and Schock split the young, good-looking, and future statewide candidate vote, then Manzullo may sneak through and eliminate them both. Plus, it makes the 16th a more efficient GOP vote sink in order to give us a shot at the 14th. If State Rep. Jack Franks (D-Marengo) runs, then we could win it, so I made it as friendly as possible. This map could result in 14 Democrats if Franks runs, especially with Joe Walsh as the Republican.
For most districts, I have Quinn/Brady, Kirk/Alexi, and Kerry/Bush numbers, in addition to Obama numbers, which are provided for every district. In the Chicago area, demographic changes make the Kerry numbers a bit low, so I use an average of Obama and Quinn for a neutral year Democratic performance. Downstate, however, the Kerry numbers are probably the best indicator of a neutral year performance. All 13 districts designed for a Democrat went for Kerry in 2004, and all three downstate Democratic districts went at least 52% for Kerry, while all 10 Chicago-area Democratic districts went at least 60% for Obama.
Note: Kerry numbers are as a percentage of the two-party vote and do not include third party candidates.
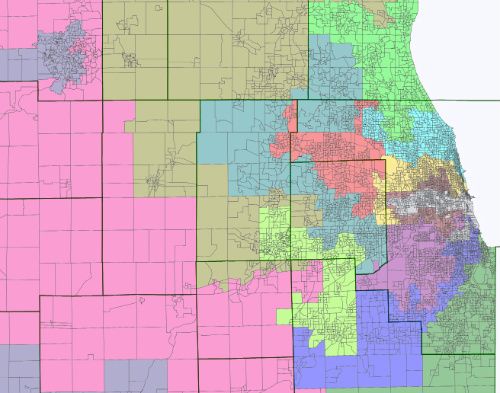
Here's the map:
Chicagoland:
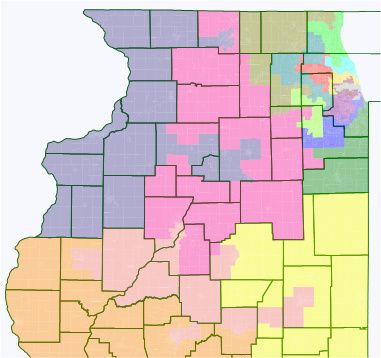
Northern Illinois:
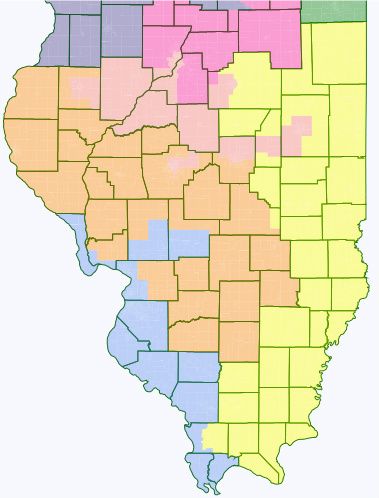
Downstate:
IL-1 (blue): Bobby Rush (D-Chicago)
Black: 50.2%, White: 39.7%; VAP: Black: 50.2%, White: 40.9%
Obama: 78.0%, McCain: 21.3%
Safe D
IL-2 (green): Jesse Jackson Jr. (D-Chicago)
Black: 55.1%, White: 29.7%, Hispanic: 12.8%
VAP: Black: 53.3%, White: 33.6%, Hispanic: 11.1%
Obama: 81.0%, McCain: 18.3%
Safe D
IL-3 (purple): Daniel Lipinski (D-Western Springs)
I understand that they wanted to protect Lipinski from a primary challenger, but there was no reason for this district to be under 60% Obama. In fact, the real district actually went for Kirk. I improved it to 60% Obama and made it an Alexi district. Also, because I have no such desire to protect the ocasionally-conservative Lipinski, I drew his previously declared primary challenger, John Atkinson, back into the district.
White: 60.0%, Hispanic: 29.4%; VAP: White: 64.6%, Hispanic: 25.1%
Obama: 60.0%, McCain: 38.7%
Quinn: 48.9%, Brady: 42.2%; Alexi: 47.4%, Kirk: 46.3%
Average D: 54.5%; Kerry: 55.3%
Safe/Likely D
IL-4 (maroon): Luis Gutierrez (D-Chicago)
Hispanic: 71.9%, White: 20.5%; VAP: Hispanic: 66.8%, White: 25.3%
Obama: 80.3%, McCain: 18.4%
Safe D
IL-5 (gold): Mike Quigley (D-Chicago)
White: 70.1%, Hispanic: 18.8%; VAP: White: 73.2%, Hispanic: 16.1%
Obama: 70.3%, McCain: 28.3%
Quinn: 55.9%, Brady: 35.8%; Alexi: 55.3%, Kirk: 39.6%
Safe D
IL-6 (teal): Peter Roskam/Judy Biggert
Biggert would likely retire, but may run in the 3rd or 11th. Randy Hultgren is drawn into this district, but he would presumably run in the 14th, leaving Roskam with this GOP vote sink. Obama still would have won it, but it is a bit more efficient than the real version, which is 51-47 Obama.
White: 80.0%; VAP: White: 82.1%
Obama: 50.2%, McCain: 48.5%
Brady: 59.7%, Quinn: 34.1%; Kirk: 63.2%, Alexi: 32.6%
Average R: 54.1%, Average D: 42.2%; Kerry: 40.9%
Safe R
IL-7 (gray): Danny Davis (D-Chicago)
Black: 53.8%, White: 26.5%, Hispanic: 12.2%
VAP: Black: 50.4%, White: 30.6%, Hispanic: 10.9%
Obama: 89.5%, McCain: 9.8%
Safe D
IL-8 (red): Open
2006 IL-6 candidate Tammy Duckworth and former Obama campaign advisor and 2010 State Comptroller primary loser Raja Krishnamoorthi are running for the Democratic nomination. Duckworth, who narrowly lost 51-49 to Peter Roskam in 2006, has received the endorsement of Dick Durbin, which should hand the nomination to her.
White: 55.2%, Hispanic: 26.6%, Asian: 11.7%
VAP: White: 60.5%, Hispanic: 22.2%, Asian: 11.9%
Obama: 61.6%, McCain: 37.0%
Brady: 48.1%, Quinn: 43.6%; Kirk: 51.1%, Alexi: 43.3%
Average D: 52.6%; Kerry: 50.5%
Lean/Likely D
IL-9 (cyan): Jan Schakowsky (D-Evanston)
White: 65.8%, Asian: 12.0%, Hispanic: 11.1%; VAP: White: 68.0%, Asian: 12.0%
Obama: 68.5%, McCain: 30.3%
Quinn: 56.2%, Brady: 37.4%; Alexi: 53.5%, Kirk: 42.7%
Average D: 62.4%; Kerry: 64.7%
Safe D
IL-10 (lime): Bob Dold! (R-Kenilworth)
Some precinct swapping in Cook County makes this a Quinn district, which should be enough to knock off Dold in 2012. Even in 2010, he only won by about 2% against retread Dan Seals. Democrats will go after him hard, to ensure he doesn't follow in Mark Kirk's footsteps and become a successful statewide candidate.
White: 60.9%, Hispanic: 21.4%; VAP: White: 64.9%, Hispanic: 18.1%
Obama: 63.0%, McCain: 35.9%
Quinn: 46.8%, Brady: 46.1%; Kirk: 53.7%, Alexi: 42.2%
Average D: 54.9%; Kerry: 54.0%
Likely D
IL-11 (chartreuse): Open
I drew former Rep. Bill Foster into this district, since he is running here anyway and he is a quasi-incumbent. Without the arm to grab Lipinski's primary challenger, it becomes much cleaner, while still being a point more favorable than the real version.
White: 54.7%, Hispanic: 26.1%, Black: 11.4%
VAP: White: 59.5%, Hispanic: 22.3%, Black: 11.0%
Obama: 62.1%, McCain: 36.7%
Brady: 45.9%, Quinn: 45.7%; Kirk: 48.1%, Alexi: 45.8%
Average D: 53.9%; Kerry: 51.5%
Likely D
IL-12 (cornflower blue): Jerry Costello (D-Belleville)
Costello's district gets 1-2 points safer in case he retires sometime this decade. Brady and Kirk are held to pluralities in this version, which makes it relatively safe for a downstate district. To achieve population equality, I added Democratic Calhoun County as well as the Dem-leaning portions of Macoupin and Montgomery Counties. These areas were part of the old 17th. Even Phil Hare won Calhoun County in 2010, and he only narrowly lost this area of Montgomery. He may have won this part of Macoupin as well. (The old 17th contained all of Macoupin County, which Hare lost, but this has just its Democratic portions). In addition, the 12th drops heavily Republican Franklin and Williamson Counties, and most of Union County, and adds swingy and light red portions of Madison County. This ended up putting John Shimkus in this district, but he would still run in the new 15th.
White: 76.8%, Black: 17.2%; VAP: White: 79.4%, Black: 15.7%
Obama: 56.7%, McCain: 41.7%
Brady: 47.5%, Quinn: 45.5%; Kirk: 48.8%, Alexi: 44.3%
Kerry: 53.1%; Average D: 51.1%
Safe D for Costello; Lean D otherwise
IL-13 (salmon): Open
The 13th grabs Peoria, which in addition to making this district more Democratic, also has the effect of screwing Aaron Schock. Schock would be boxed in to the south by this district, and to the north, he would be drawn into the 16th along with Donald Manzullo and Adam Kinzinger. Tim Johnson lives here, but would probably run in the 18th. The drop-off in the midterms was especially staggering here, as it largely relies on student turnout in Urbana-Champaign. However, Kirk was held to a plurality in this version and both Quinn and Alexi got over 40% in 2010, compared to 37% and 38% respectively in the actual version, and the average D still would be a plurality here. This would be likely D in 2012, unless Johnson runs, but I still think we would be favored in that situation. It should be an easy hold in presidential years, but whoever wins this must run a good GOTV for the midterms.
White: 75.4%, Black: 14.6%; VAP: White: 78.6%, Black: 12.6%
Obama: 59.1%, McCain: 39.1%
Brady: 50.1%, Quinn: 40.3%; Kirk: 49.4%, Alexi: 41.1%
Kerry: 52.2%; Average D: 49.7%, Average R: 44.6%
Lean D vs Johnson, Likely D otherwise
IL-14 (olive): Joe Walsh/Randy Hultgren
This is drawn for State Rep. Jack Franks to potentially win. He is probably the only candidate who can do so. To give you an idea of how strong he is, he was re-elected with 63.9% of the vote in 2010, even as his state house district went 56-33 for Bill Brady. His state house district also went only 51-47 for Obama, so this district is actually more friendly than his state house district. For Franks, the ideal CD consists of almost all of McHenry County, where his state house district is located. In addition, I grabbed extra Democrats from DeKalb County, which was residing in the 16th at the time, so adding extra Democrats didn't harm any other districts. So, in effect the district is Franks' base plus a bunch of extra Democrats. Assuming Walsh is the nominee, this could even tilt in our direction. Remember, Melissa Bean won IL-8 in 2004, even as Kerry got just 44%, so 42% Kerry isn't impossible, especially with a candidate of Franks' caliber. Plus, the Average R would have only achieved a plurality here, so its not at all impossible.
White: 78.5%, Hispanic: 13.7%; VAP: White: 81.6%, Hispanic: 11.3%
Obama: 53.4%, McCain: 45.2%
Brady: 54.3%, Quinn: 35.5%; Kirk: 56.7%, Alexi: 34.5%
Average R: 49.8%, Average D: 44.5%; Kerry: 42.0%
Lean D: Franks vs. Walsh; Tossup: Franks vs Hultgren; Likely R otherwise
IL-15 (orange): John Shimkus (R-Collinsville)
It swings west to grab Quincy, which accounted for almost half of Phil Hare's loss margin in 2010.
White: 93.3%; VAP: White: 94.1%
McCain: 55.3%, Obama: 43.0%
Safe R
IL-16 (deep pink): Donald Manzullo/Aaron Schock/Adam Kinzinger
Kinzinger is actually drawn into IL-2, a black-majority district, but he plans to run against Manzullo in the Republican primary. In addition, my map puts Schock into this district, rather than giving him a vote sink, which the real map does. This could eliminate both Schock and Kinzinger, potentially strong statewide candidates, by putting them in a primary with 3 Republican incumbents. I'm not sure how many times two incumbents have lost in the same primary, but this would be interesting. This also becomes a much more efficient vote sink in my version. The current version went 50-48 for Obama, compared to 53-46 for McCain in this map.
White: 87.6%; VAP: White: 89.6%
McCain: 52.9%, Obama: 45.5%
Safe R
IL-17 (dark slate blue): Bobby Schilling (R-Colona)
The Quinn and Alexi numbers here WAY understate Democratic strength. Phil Hare, of all people, ran 7% ahead Quinn in the old 17th and still lost by 11%. In fact, Quinn, Alexi, and Hare all lost the Democratic stronghold of Rock Island County, so this was largely caused by weak Democrats running. Any competent Democrat should win here, especially against the underwhelming Bobby Schilling. The real map had this district go into Peoria, which is unnecessary and counterproductive. The 13th needs Peoria much more, as its problem is Democratic turnout, whereas the 17th's problem is incompetent Democratic nominees. Plus, in my version, the Obama percentage improves by 4.5% in the 13th, and only drops 1.4% here, since it takes in Democratic areas that were being wasted in the 16th, a GOP vote sink. Plus, even in this version, the Average D still manages an ever-so-narrow plurality and went 52% for Kerry.
White: 79.9%; VAP: White: 83.8%
Obama: 58.4%, McCain: 40.0%
Brady: 55.9%, Quinn: 37.8%; Kirk: 56.2%, Alexi: 37.6%
Kerry: 52.3%; Average D: 48.1%, Average R: 48.0%
Likely D
IL-18 (yellow): Tim Johnson (R-Urbana)
The nice thing about this map is that it screws Aaron Schock rather than Tim Johnson. The 13th becomes a solid democratic district, but leaves open this GOP vote sink for the quasi-moderate Johnson, as opposed to the actual map, where he would either run in the light blue 13th, which he would have an outside shot at winning, or face Shimkus in a primary, while Schock would stay in Congress. So my version gives a vote sink to a quasi-moderate, which prevents him from taking a Dem-leaning district, and eliminates a potential statewide candidate in Aaron Schock.
White: 91.1%; VAP: White: 92.5%
McCain: 55.7%, Obama: 42.6%
Safe R
