Over the last several weeks, David Sirota has been pushing his theory of a "race chasm." The theory is where black numbers are overwhelming white racism can be overcome, and where black populations are scarce, there isn't a history of racial politics, so Obama can win white voters, but in those states in the middle, he tends to lose, or at best win narrowly. In his
Looking at the county-by-county breakdown in many states, from ones Clinton has won to ones that Obama has won, it's clear that Obama does worse, overall, in overwhelmingly white counties in Appalachia. But I didn't have concrete data, so I decided to look at my own state, PA, in great detail. And I found a few surprising things...
First, I nabbed census data from 2006 on the black population of all counties in PA. Then, looking at exit polls, I determined that blacks turned out at 124.8% for Obama compared to their statewide population level (rather low compared to other states, where the number is generally 150%), and adjusted the numbers slightly upward accordingly. I then subtracted this from the total Obama vote in each county, to come up with a projected non-black Obama vote (fairly close to a white vote in most places).
Then I plotted out the projected non-black Obama vote versus the projected black Obama vote, and came up with this chart (excluding Philly as it compresses all other results).
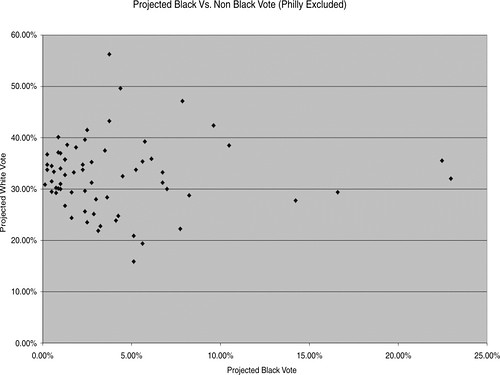
I tried multiple trendlines, and there is no trend, except perhaps a very slight likelihood Pennsylvania voters would vote for Obama if they lived in a county with more black voters.
I also threw together this map of non-black support for Obama:
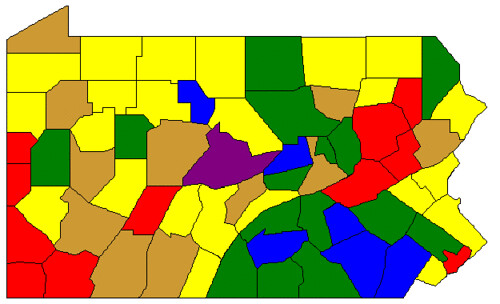
Purple = Obama majority (Centre county)
Blue = 49.99%-40% Obama
Green = 39.99%-35% Obama
Yellow = 34.99%-30% Obama
Orange = 29.99%-25% Obama
Red = Under 24.99% Obama
I'm not going to comment on the regions except to note that overwhelmingly white (and notoriously racist), South-Central PA was strong for Obama among non-black voters, while overwhelmingly white (and slightly less notoriously racist) areas of Southwest PA and the Scranton region were incredibly weak for him. This furthers my theory that Obama doesn't have a racial gap problem, he has a problem with Appalachian voters, who tend towards racism despite not knowing many black people, and also tend to be registered Democrats, unlike racists in South Central PA.
However, there were two notable things the data suggests as to why Obama lost.
- The exit polls show 37% of whites voted for Obama. However, only sixteen of the 76 counties show a non-black percentage greater than 37, and many of these, as you can see on the map above, are in rural areas with a small population. Latinos and Asians may be a factor here, but when I have more time I'll look at the actual vote totals and try to interpret what went wrong. My guess is mainly either the exits were off, or some whites were lying, and Obama's support was actually lower.
- Something went really wrong with Philly. Philly went for Obama by a 30-point margin, at 65% to 35%. However, Philly in 2006 was 45.8% Black. Using the 124.8% black turnout, Blacks should have made up 57.16% of Obama's Philly vote. This would mean that Obama's non-black support in Philadelphia was only 7.84% of the voting public. This is less than half of Obama's non-black vote in the next most anti-Obama county, Fayette. It would also mean roughly four out of five of the white/latino/asian residents of Philly voted for Hillary. As this seems unlikely, as does a huge spike in Hillary votes by blacks in Philly that hasn't been seen elsewhere, something tells be black turnout in Philly was much lower than it was elsewhere in the state. Maybe not paying the street money bit Obama in the ass?
Anyway, I went into this trying to prove Sirota wrong, and instead I may have discovered the key to why Obama lost by nine points instead of six or seven. Go figure.
