So I was trying to come up with what a court-drawn Texas map would look like. No, not like the San Antonio court drew - that map largely followed the lines the GOP drew, especially in Houston and DFW (even before the Supreme Court said they had to follow the legislature-drawn lines even more closely). Rather, I wanted to figure out what a genuinely neutral map, drawn from scratch, would look like. (It's sort of similar to what KingofSpades recently did, for those who just can't get enough of their Texas redistricting counterfactuals.)
It turned out to be terribly easy to draw four Dem districts in Houston, and three in Dallas (rather than three and two respectively, as we currently have)...
Here's what I got for Houston:
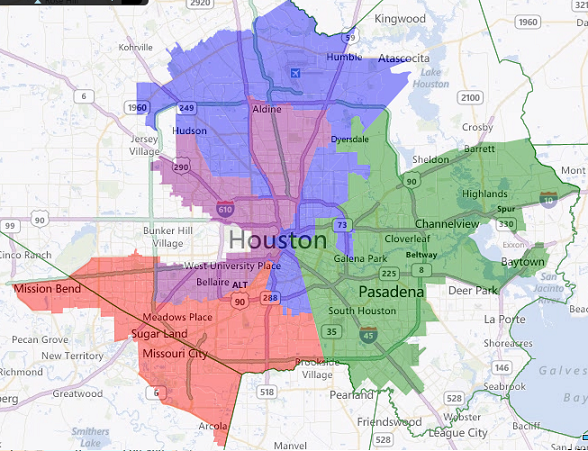
TX-18 (Blue):
Population: 16.4% White/35.8% Hispanic/41.9% Black
VAP: 19.4 W/31.9 H/42.7 B SSVR: 13.9
Obama '08: 75/25 Dem: 70.3/29.7
Current District VAP: 20.2 W/34.5 H/41.4 B, Obama 77/23
(Current district numbers are from TDDVandy's diary.)
Sheila Jackson-Lee's district takes in a bit less of northwest Houston and a bit more of northeast and north Houston, but it actually becomes a slightly stronger district for African Americans.
TX-29 (Green):
Pop: 17.8 W/67.5 H/11.1 B
VAP: 21.6 W/63.2 H/11.4 B SSVR: 42.8
Obama: 57.2/42.8 Dem: 58.4/41.6
Current District VAP: 14.8 W/72.7 H/10.7 B, Obama 62-37
Gene Green's district gives up the heavily Hispanic slice of north Houston, which causes it to spread out to the east to Baytown. This definitely weakens it a bit, but it is still essentially a safely Dem district, not so different from Laredo-based TX-28. And it would still be quite likely to elect the Hispanic candidate of choice. Perhaps a court would be willing to do this if it allowed for the creation of...
TX-7 (Purple):
Pop: 28.1 W/56.4 H/9.1 B
VAP: 33.0 W/50.8 H/9.3 B SSVR: 26.5
Obama: 57.1/42.9 Dem: 54.4/45.6
You might want to call this "likely Dem," but really I think it would be exceedingly unlikely to elect a Republican, and would only become more Dem-leaning, with increasing Hispanic voting strength, as the decade progressed. And though most of the people in the district are Hispanic, whites would very likely comprise a majority of the electorate. But many of these are Houston inside-the-loop liberal whites, who themselves are probably trending Dem as well. I would consider this a Hispanic influence district.
The main logic for drawing this district, as I figure it, is that a court would look at demographic change in Harris County - where the population grew by 20% from 2000-2010, blacks grew by 22%, Hispanics grew by 49%, but the white population actually shrank by 6% - and decide that minorities had "earned" another district relative to the previous decade's GOP gerrymander. (To put that another way: Harris County gained 692,000 people in the 2000s - almost exactly one congressional district's worth of people - and more than 100% of that growth was among minorities. From a neutral perspective, at least one additional minority influence district seems like a no-brainer.)
TX-9 (Red):
Pop: 15.6 W/32.6 H/37.6 B/12.5 A
VAP: 18.3 W/29.4 H/37.0 B/13.8 A SSVR: 14.0
Obama: 72.9/27.1 Dem: 68.1/31.9
Current district VAP: 13.9 W/34.0 H/39.6 B, Obama 76-23
Al Green's district doesn't change much, though it gains some of the liberal(ish) white areas from John Culberson's current TX-7, and gives away some Hispanic areas to the new TX-7. Still all but certain to elect the African American community's candidate of choice.
* * * * *
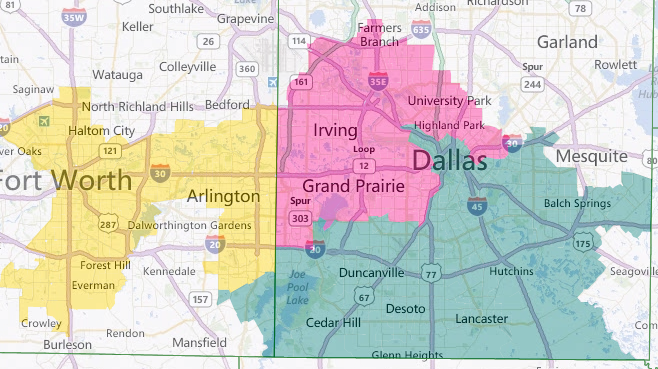
And here's Dallas:
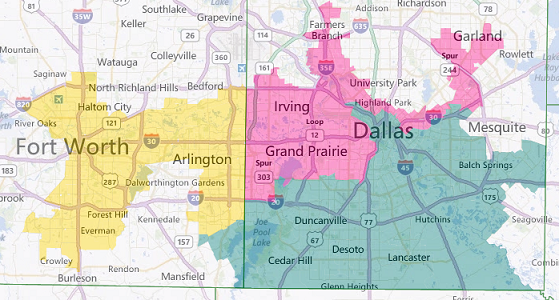
TX-30 (Teal):
Pop: 18.1 W/32.7 H/45.8 B
VAP: 22.0 W/28.3 H/46.4 B SSVR: 11.5
Obama: 78.0/22.0 Dem: 72.9/27.1
Current district VAP: 21.4 W/30.1 H/46.4 B, Obama 78-21
No significant changes for Eddie Bernice Johnson's district, though it does duck into Tarrant County a smidge.
TX-33 (Yellow):
Pop: 27.5 W/41.4 H/24.3 B
VAP: 32.8 W/36.3 H/24.0 B/5.0 A SSVR: 17.3
Obama: 63.1/36.9 Dem: 58.5/41.5
Current district VAP: 18.4 W/61.3 H/17.8 B, Obama 69-31
The Mark Veasey district looks much more similar to the way it was drawn by the San Antonio court - it stays entirely within Tarrant County, and gains black and white population while losing Hispanic population. So given that the court actually drew the district this way, it seems reasonable to think a court drawing a map from scratch would do something similar.
TX-24 (Pink):
Pop: 21.2 W/63.2 H/11.4 B
VAP: 26.6 W/57.3 H/11.7 B SSVR: 30.7
Obama: 60.9/39.1 Dem: 57.5/42.5
And here's the thing: if you decide to draw a Dem district entirely within Tarrant County, it becomes quite easy to draw a second one in Dallas County. What's more, this district would stand a better chance of electing Hispanics' candidate of choice than the current TX-33, since the district's Dem lean relies less on African Americans. And given that there are about 940,000 fairly well-concentrated Hispanics in Dallas County alone, it seems eminently reasonable to have a district that is clearly anchored in the Hispanic community.
And interestingly, even if you completely ignore those considerations, the most natural way to draw a second Dallas County district would be, in my opinion, like this:
Here I basically ignored race and voting tendencies and just drew as compact and natural-seeming a district as possible. And what that gets you is this:
Pop: 30.3 W/53.8 H/9.9 B
VAP: 35.7 W/47.9 H/10.1 B SSVR: 24.9
Obama: 54.8/45.2 Dem: 50.3/49.7
This district would perhaps be just slightly Dem-leaning. And, in the way of nearly all Texas districts, the minority share of the electorate would be certain to grow over the course of the decade, so that it would be much more solidly Dem by 2020. And that's without even trying to draw a Dem or minority district at all!
So here's what I think. I think that a truly neutral court-drawn 2010 Texas redistricting map would have drawn four Dem districts in Houston and 3 in Dallas. As for the rest of the state... Well, the San Antonio court really did go their own way in Central Texas, drawing 3 Dem districts between Austin and San Antonio (as opposed to the current 2); see their work here, with Obama/McCain numbers here. Then there are the 3 South Texas Hispanic districts and the El Paso district. And if you count Pete Gallego's TX-23 as a Dem district (which would have been drawn stronger for us anyway), that would be a 21R-15D map, or 21-14-1 with the more conservative approach in Dallas County - and, at 52/47 Republican, Michael McCaul's TX-10 would at least be interesting. In addition to bolstering minority representation in accord with their increasing share of the population, the 21/15 ratio (58% republican to 42% Democrat) is a very accurate reflection of Texas' overall voting tendencies - another indication of a quality neutral map. Such a map, then, would have given us 3 additional Dem districts in Texas, one each in Austin, Dallas, and Houston, and would have placed one of those Republican districts (TX-10) within reach.
So what do you think? In particular:
1) Do you think either the 4th Houston or 3rd DFW district should have been mandated by the VRA? Or on the contrary,
2) Did I weaken the eastside Hispanic district in Houston too much in carving out the new Hispanic influence district on the west side? I don't really know enough about the VRA to say, so I'd welcome input from those who know more about the legal ins and outs than I do.
3) Do you think we would have seen districts like this in a genuinely neutral Texas map?
