Hello! First things first, my apologies if this diary isn't as pretty as others. This is my first DK diary (though I am a very longtime lurker, all the way back to 2005), as well as my first foray into the awesome world of Dave's Redistricting App. I was a bit apprehensive at first, but when I saw that the fine folks at DKE were offering babka in exchange for a redistricting map of my adoptive hometown I just couldn't resist. Please let me know (in comments, I suppose) any questions/suggestions/concerns/whatever you might have--just don't be too harsh!
Out of all the contest specifications, my personal top priority was drawing districts that kept neighborhoods together. As a (non-native) Chicagoan, I know how important neighborhoods are to this city, so it seemed most correct to keep them together as much as I could. This might have come at the expense of one or two more black supermajority (defined as 60% TotalPop or 65% VAP) districts, but that was not the main gestalt of my redistricting. That said, I was able to produce 15 African American-supermajority and 10 Hispanic-supermajority districts, an admirable (IMHO) number given that I didn't want to gerrymander too much. This, along with the 8 additional minority-majority districts, makes for quite the diverse map.
Additionally, I was able to put all of Chinatown in the 3rd district, which is now plurality Asian. I also left the 14th and 33rd districts mostly intact and kept the numbering of all the districts consistent with past usage. I tried not to have the population differ too much by geographic region, but demographic trends sometimes made this a bit difficult. Most of the incumbents should also still be in their districts.
A few notes: the percentages below are all % Voting Age Population, but "Total Population" is the number of people, regardless of age, who live in the district. The top population line is bolded when that line's (non-White) race has a supermajority in the district; italics are used when a (non-White) racial group has a plurality.
Anyway, if you'll follow me below the squiggly orange lines, I hereby present my entry for the DKE Chicago Redistricting Contest...
(PS: Here is the DRA file, if anybody cares.)
(PPS: And here is a spreadsheet of the makeup of new districts, compared to old districts--this sounds confusing, but hopefully you know what I mean, and if you don't you'll find out if you click the link!)
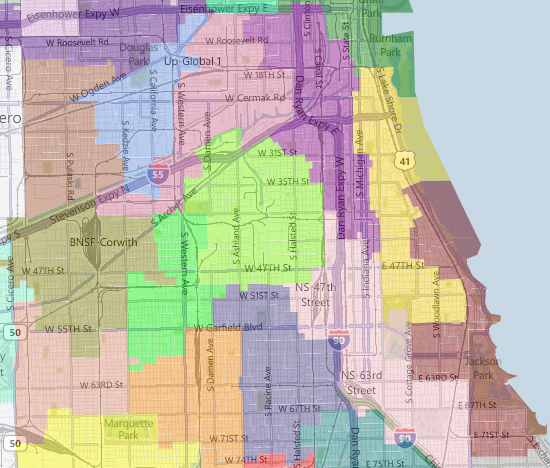
South Side
District 3 [Purple] (Armour Square, Chinatown)
35.78% Asian
28.77% White
25.05% Black
8.71% Hispanic
1.91% Other
Total Population: 53877
District 4 [Yellow] (Bronzeville, Douglas, Grand Boulevard, Kenwood)
64.35% Black
20.89% White
9.01% Asian
3.35% Hispanic
2.41% Other
Total Population: 52940
District 5 [Maroon] (Hyde Park, Oakland, South Shore)
68.27% Black
20.41% White
5.75% Asian
3.23% Hispanic
2.33% Other
Total Population: 56458
District 11 [Lime] (Bridgeport, McKinley Park)
52.20% Hispanic
30.05% White
13.86% Asian
2.98% Black
0.90% Other
Total Population: 56255
District 12 [Light Blue] (Little Village)
59.12% Hispanic
30.76% Black
8.17% White
1.37% Asian
0.58% Other
Total Population: 51692
District 13 [Salmon] (West Elsdon, West Lawn)
74.95% Hispanic
20.16% White
3.71% Black
0.65% Asian
0.52% Other
Total Population: 51298
District 14 [Olive] (Archer Heights, Elsdon)
77.51% Hispanic
16.68% White
2.78% Black
2.70% Asian
0.33% Other
Total Population: 51696
District 15 [Orange] (Chicago Lawn, West Englewood)
76.97% Black
19.35% Hispanic
2.48% White
0.92% Other
0.28% Asian
Total Population: 51699
District 16 [Green] (Brighton Park, Gage Park)
82.09% Hispanic
8.31% Black
7.43% White
1.76% Asian
0.41% Asian
Total Population: 52602
District 17 [Dark Blue] (Back of the Yards, Englewood)
90.84% Black
7.04% Hispanic
1.15% Other
0.85% White
0.12% Asian
Total Population: 51542
District 20 [Light Pink] (Brookdale, Fuller Park, Washington Park, Woodlawn)
94.95% Black
1.73% Hispanic
1.61% White
1.41% Other
0.60% Asian
Total Population: 52011
District 22 [Sienna] (Lawndale, Little Village)
66.50% Hispanic
30.75% Black
2.13% White
0.49% Other
0.13% Asian
Total Population: 51784
District 25 [Pale Violet Red] (Pilsen, University Village)
68.64% Hispanic
16.67% White
7.04% Black
6.55% Asian
1.10% Other
Total Population: 51284
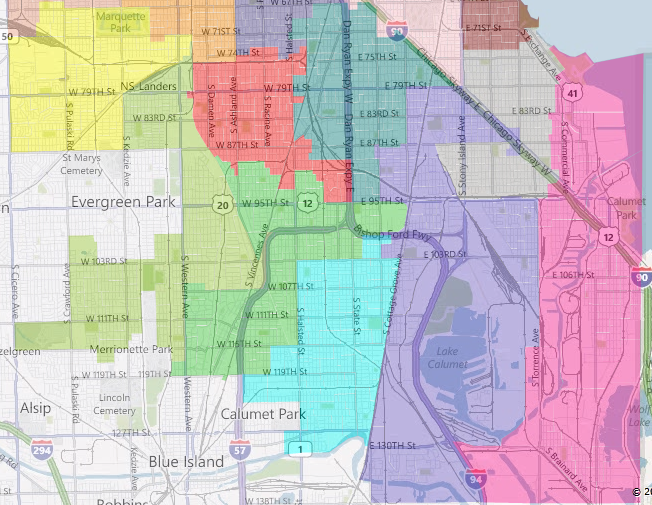
Far South Side
District 6 [Dark Turquoise] (Chatham, Greater Grand Crossing)
97.24% Black
1.21% Other
0.94% Hispanic
0.51% White
0.10% Asian
Total Population: 54569
District 7 [Gray] (Calumet Heights, Cheltenham)
93.96% Black
3.08% Hispanic
1.46% Other
1.25% White
0.24% Asian
Total Population: 52296
District 9 [Cyan] (Roseland, Stewart Ridge)
95.24% Black
3.02% Hispanic
1.03% Other
0.64% White
0.07% Asian
Total Population: 54111
District 18 [Yellow] (Scottsdale, West Lawn)
45.70% Hispanic
33.96% Black
18.52% White
0.94% Asian
0.88% Other
Total Population: 52233
District 19 [Army Green] (Ashburn, Beverly Hills, Mount Greenwood)
60.64% White
33.35% Black
4.40% Hispanic
1.05% Other
0.57% Asian
Total Population: 54335
District 21 [Red] (Auburn Gresham)
97.92% Black
0.92% Other
0.78% Hispanic
0.30% White
0.09% Asian
Total Population: 52412
District 34 [Kelly Green] (Morgan Park, Washington Heights)
91.80% Black
5.69% White
1.17% Hispanic
1.16% Other
0.19% Asian
Total Population: 54678
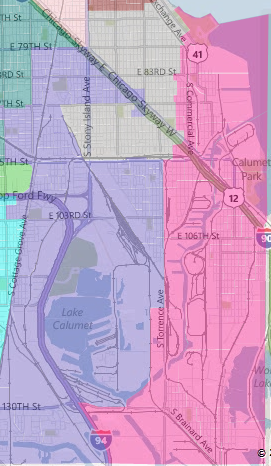
Southeast Side
District 8 [Slate Blue] (Avalon Park, Burnside, Jeffrey Manor, Pullman)
92.10% Black
4.56% Hispanic
2.00% White
1.24% Other
0.10% Asian
Total Population: 52596
District 10 [Pink] (Calumet, Hegeswich, Irondale, South Deering)
57.53% Hispanic
22.30% White
18.95% Black
0.84% Other
0.38% Asian
Total Population: 52752
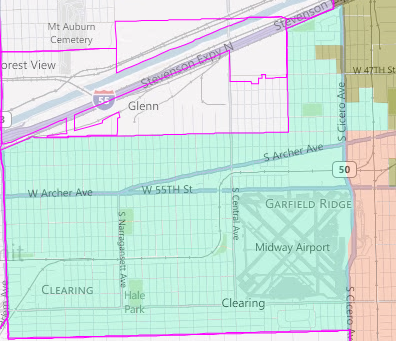
Far West Side
District 23 [Aquamarine] (Clearing, Garfield Ridge, Midway Airport)
62.37% White
33.14% Hispanic
2.99% Black
0.87% Asian
0.63% Other
Total Population: 51458
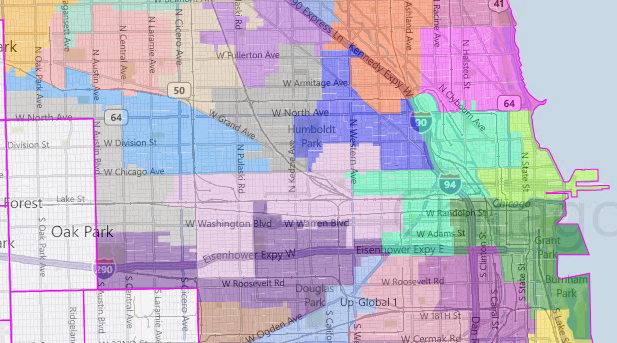
Lower North Side
District 1 [Blue] (Maplewood, Noble Square, Wicker Park)
56.77% White
29.41% Hispanic
7.56% Black
4.35% Asian
1.91% Other
Total Population: 53877
District 2 [Forest Green] (Loop, West Loop)
62.60% White
16.87% Asian
12.00% Black
6.08% Hispanic
2.45% Other
Total Population: 52556
District 24 [Dark Violet] (East Garfield Park, North Lawndale)
87.20% Black
4.83% Hispanic
4.75% White
2.14% Asian
1.08% Other
Total Population: 51861
District 26 [Slate Gray] (Humboldt Park, Logan Square)
63.30% Hispanic
21.75% White
12.41% Black
1.43% Asian
1.10% Other
Total Population: 56535
District 27 [Medium Spring Green] (Near North Side, Old Town, West Town)
62.81% White
16.63% Black
12.07% Hispanic
6.79% Asian
1.71% Other
Total Population: 55213
District 28 [Light Pink] (Humboldt Park, Ukrainian Village, West Garfield Park)
61.10% Black
25.18% White
11.13% Hispanic
1.42% Asian
1.17% Other
Total Population: 54859
District 29 [Dark Gray] (Austin, Galewood)
87.99% Black
5.33% Hispanic
5.26% White
0.89% Other
0.53% Asian
Total Population: 51781
District 30 [Salmon] (Belmont Central, Cragin)
74.73% Hispanic
18.34% White
4.01% Black
2.26% Asian
0.67% Other
Total Population: 54239
District 37 [Sky Blue] (Austin, Humboldt Park)
66.14% Black
27.41% Hispanic
4.93% White
0.78% Asian
0.75% Other
Total Population: 51280
District 42 [Green Yellow] (Gold Coast, River North, Streeterville)
78.38% White
11.47% Asian
4.68% Hispanic
3.77% Black
1.70% Other
Total Population: 53886
District 43 [Magenta] (Lincoln Park)
84.78% White
5.24% Asian
4.79% Hispanic
3.60% Black
1.60% Other
Total Population: 55813
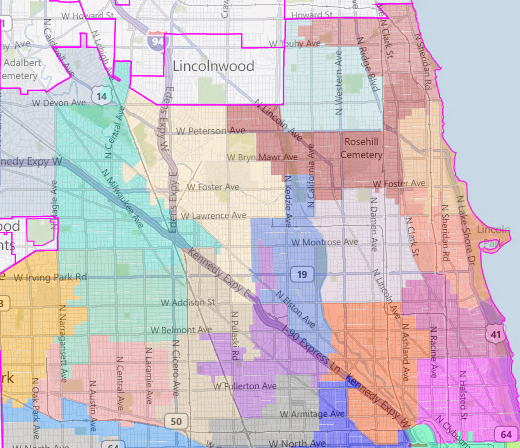
Upper North Side
District 31 [Tan] (Hermosa, Irving Park)
66.03% Hispanic
27.42% White
2.77% Black
2.76% Asian
1.02% Other
Total Population: 54980
District 32 [Red] (Bucktown, Roscoe Village)
77.75% White
13.25% Hispanic
4.70% Asian
2.76% Black
1.54% Other
Total Population: 51812
District 33 [Royal Blue] (Albany Park, Avondale, Irving Park)
46.93% Hispanic
37.45% White
10.03% Asian
3.50% Black
2.09% Other
Total Population: 54521
District 35 [Medium Orchid] (Avondale, Logan Square)
62.17% Hispanic
29.62% White
3.77% Black
3.09% Asian
1.34% Other
Total Population: 55851
District 38 [Medium Aquamarine] (Portage Park)
51.32% White
41.58% Hispanic
4.44% Asian
1.45% Black
1.20% Other
Total Population: 56553
District 39 [Khaki] (Albany Park, Sauganash)
49.23% White
28.96% Hispanic
16.15% Asian
3.16% Black
2.50% Other
Total Population: 56581
District 40 [Firebrick] (Lincoln Square, North Park)
53.79% White
19.53% Hispanic
17.08% Asian
7.04% Black
2.56% Other
Total Population: 53933
District 44 [Medium Violet] (Lakeview, Wrigleyville)
83.16% White
6.16% Hispanic
6.14% Asian
2.84% Black
1.70% Other
Total Population: 56543
District 45 [Turquoise] (Jefferson Park)
71.35% White
18.31% Hispanic
7.81% Asian
1.53% Other
0.99% Black
Total Population: 56074
District 46 [Tomato] (Ravenswood)
60.78% White
16.81% Black
11.08% Hispanic
9.06% Asian
2.28% Other
Total Population: 53977
District 47 [Thistle] (Lincoln Square, North Center)
75.47% White
13.96% Hispanic
6.00% Asian
2.71% Black
1.86% Other
Total Population: 55555
District 48 [Light Salmon] (Andersonville, Edgewater, Summerdale)
56.07% White
16.27% Black
13.45% Asian
11.71% Hispanic
2.50% Other
Total Population: 54984
District 49 [Indian Red] (Rogers Park)
43.22% White
25.59% Black
20.12% Hispanic
8.16% Asian
2.92% Other
Total Population: 55343
District 50 [Light Blue] (West Rogers Park)
45.69% White
23.44% Asian
18.06% Hispanic
9.97% Black
2.84% Other
Total Population: 56434
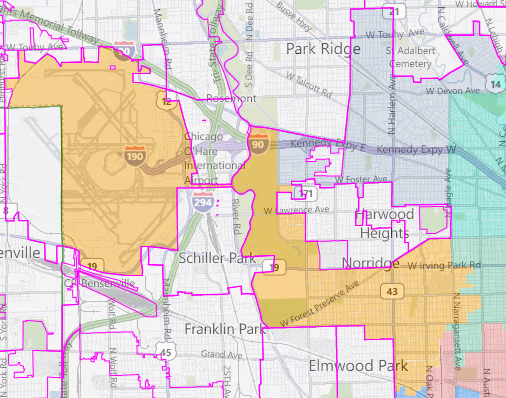
Northwest Side
District 36 [Orange] (Dunning, Montclare, O'Hare Airport)
69.85% White
24.53% Hispanic
3.59% Asian
1.11% Black
0.92% Other
Total Population: 56108
District 41 [Light Steel Blue] (Edison Park, Norwood Park)
84.06% White
8.80% Hispanic
5.21% Asian
0.98% Black
0.95% Other
Total Population: 55231
