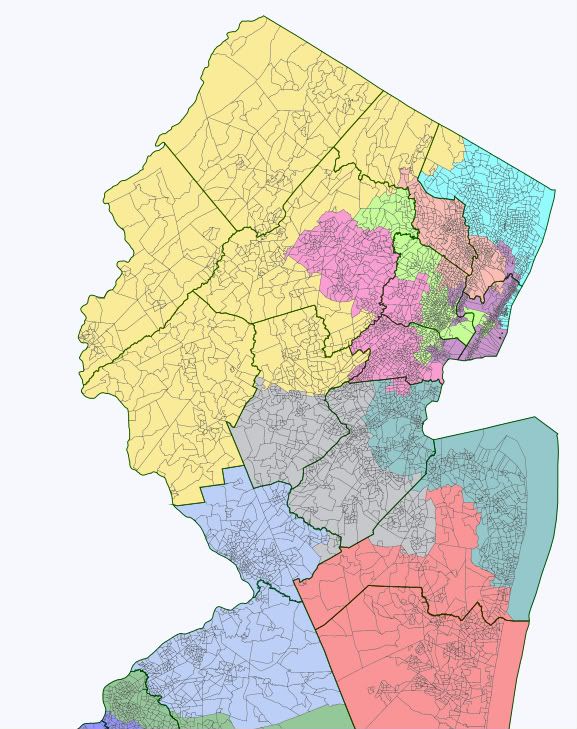
I decided to try my own map for New Jersey after reading here on DKE in discussing the new NJ map that the reason for a 6-6 map in New Jersey was that Democratic strength was too concentrated to produce a map that reflected the political leanings of New Jersey more adequately. I beg to differ. My plan was to find a map that maximizes Democratic performance while staying clean enough to be submitted to a bipartisan redistricting board like in NJ with any chance to be taken. Many Democratic incumbents might not be happy with this map, but producing a 10-2 map should be worth it. I don’t know New Jersey too well, actually at all, so I might have screwed up with some big no-no that I don’t know of (like never splitting Bucks County, or the Eastern Shore). If so, just tell me…
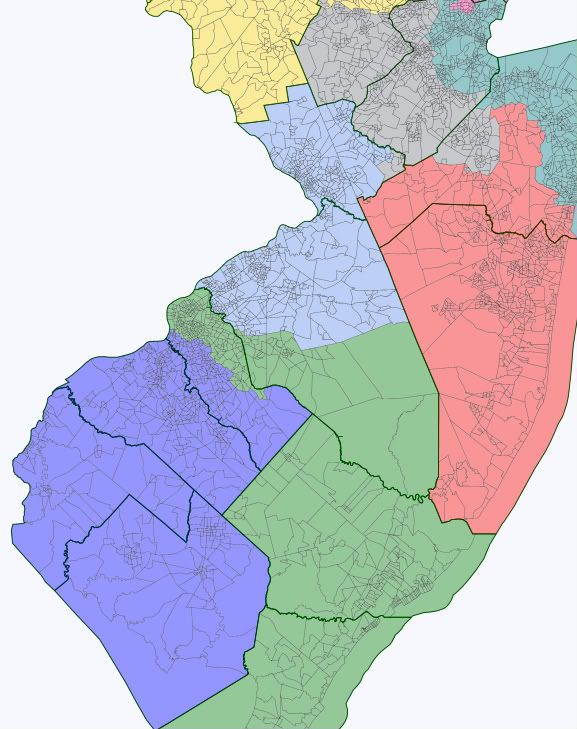
CD 1 (blue – Rob Andrews): Rob Andrews gets a still safe seat, but considerably less blue than before in order to get rid of LoBiondo. This district now includes Salem, Cumberland and all of Gloucester Counties and in return gives up even bluer parts of Camden County. Still a 59% (was 65%) Obama district (57,5 Dem average). 73,3% white. Safe Dem.
CD 2 (green – Frank LoBiondo): Losing Salem, Cumberland and parts of Gloucester Counties means the 2nd CD can stretch into Camden County to take in heavily blue areas which will make it very difficult if not impossible for LoBiondo to survive. This is a 60% (was 54%) Obama district (56,7% Dem average). 67% white. Lean Dem even with LoBiondo, safe Dem without.
CD 3 (purple – Albio Sires): I decided to get rid of Runyan’s district, so the 3rd is the new 13th, the Hispanic VRA district. It doesn’t stretch south to include the Hispanic areas in Perth Amboy anymore, but it now includes the Hispanic parts of Newark and a few precincts in Bergen County. “Reasonably compact” is always a matter of contention I guess, but I don’t think my 3rd is worth than the 13th before. It’s a 71% (was 75%) Obama district (70,9% Dem average). 51.3% Hispanic. Safe Dem.
CD4 (red – open): I never thought it might be that much fun to draw a Republican vote sink. I had most of the fun after the fact actually, as I drew most of the lines without knowing about the incumbents residencies. So I form a Republican vote sink with parts of the districts of two Republican congressmen, and probably neither of them will return to Congress. It doesn’t even look like a vote sink, as I basically just took Ocean County and added a few red parts of Monmouth County to add the required population, no more Mercer or Burlington Counties. Neither Jon Runyan nor Chris Smith live in this district, as both live in the uber-blue district that is now the 12th, though Smith would probably run here and win against Runyan. Problem is, he will probably not only face Runyan, but also an Ocean County Republican, as the County now stays together unsplit. Not that this probable successor will be any better than Smith. It is a 41% (was 47%) Obama district (41% Dem average). 87,5% white. Safe Republican.
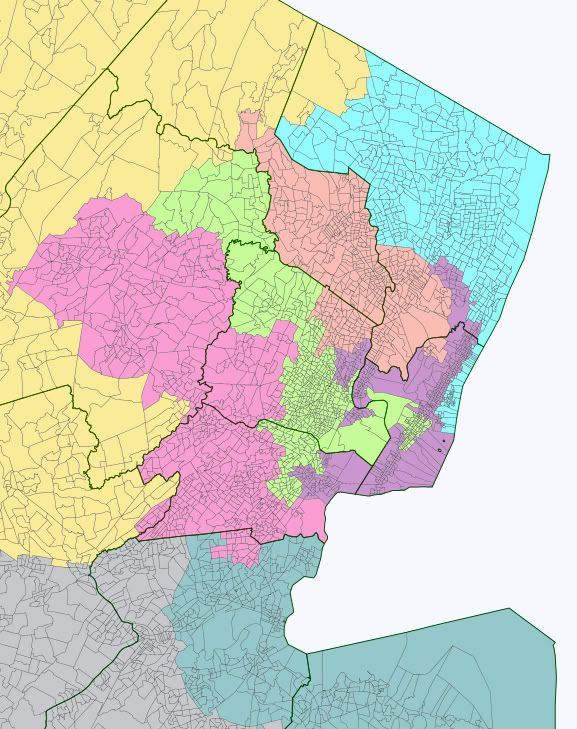
CD 5 (yellow – Scott Garrett, Leonard Lance, Rodney Freylinghusen): Another fun Republican vote sink throwing together not two but three Republican congressmen. Garrett, Lance and Freylinghusen all live in this district which combines all the dark red parts of North Jersey. The district mostly withdraws from Bergen County (including some pretty red area itself) and adds Hunterdon and the uber-red parts of Morris and Somerset Counties. Garrett might have the upper hand in the primary, as it is mostly his turf and he is the nuttiest of the bunch as well. Oh well. It is a 42% (was 45%) Obama district (but only 37,4% Dem average). 86,9% white. Safe Republican.
CD 6 (teal – Frank Pallone): Pallone really takes quite a few hits for the team on this one, going from a deep-blue seat to one that is considerably more swingish, even though it keeps its general form. But still it adds a few pretty red precincts in Monmouth County and loses blue area in Middlesex County. He should be safe though, but open this seat might, just might swing. It’s a 55% (was 60%) Obama district (54,2% Dem average). 62,3% white. Strong Dem.
CD 7 (grey – open): Lance might run here after all, though very little of his former district stays in this one. Just the Somerset County part of this district overlaps with the former 7th district, but it doesn’t matter anyway. Lance will not win here, it is too blue and ripe for the picking of a Middlesex County Democrat, maybe State Sen. Linda Greenstein. It’s a 59% (was 51%) Obama district (55,5% Dem average). 59,8% white, then 17,1% Asian. Safe Dem.
CD 8 (tomato – Bill Pascrell): A district still centered in Paterson, but instead of deeply extending into Essex County, now includes parts of Bergen County as well without touching Rothman’s residency. Pascrell is safe. It’s a 60% (was 63%) Obama district (59,7% Dem average). 53,5% white, then 29,4% Hispanic. Safe Dem.
CD 9 (cyan – Steve Rothman): This district changes a lot, loses big parts of its Bergen County area to CD 8 and adding other areas there from CD 5, which are way redder. Rothman is another one who takes a hit or two for the team, but he should be fine as well. At least he still has a district in this plan. It’s a 56% (was 61%) Obama district (55,4% Dem average). 64,3% white. Strong Dem.
CD 10 (chartreuse – Don Payne): This Black VRA district doesn’t look as neat as before as I didn’t see a point in adding strongly white, but also deep blue areas in Essex County to it and instead extended it further north to include red areas in Northern Essex County and even Morris County. Payne will survive it. It’s a 79% (was 87%) Obama district. 50,3% Black. Safe Dem.
CD 11 (pink – open): This district changes dramatically, as it still includes parts of Morris County, but only the swingy parts and then adds blue areas in Essex and especially Union County which is the new population center of the district. Freylinghusen doesn’t have a chance here and would probably lose to a Union County Democrat. Maybe Assemblywoman Linda Stender would run here. It’s a 55% (was 45%) Obama district (52,2% Dem average). 65,9% white. Lean Dem.
CD 12 (Cornflowerblue – Rush Holt, Jon Runyan, Chris Smith): Deep blue, nuff said. The district now includes most of blue Mercer County and hardly less blue parts of Burlington County. No chance for Runyan or Smith, this is Holt-country. Holt is actually the only Dem incumbent to get a bluer district, the bluest non-VRA-district. It’s a 64% (was 58%) Obama district (58,9% Dem average). 63,8% white. Safe Dem.
So I think this makes clear that Democratic voters in New Jersey are not too concentrated to put up a map that better reflects its Democratic nature. But the map would look radically different that today’s, and a commission like in NJ will probably not go that route…
So what do you think? Any big faux-pas?
